Hope you have already checked the free Website Speed Insight tools we highlighted before two weeks, and this week we would like to share the best infographic tools which can help you to present information graphics directly to your reader rather than scrolling down lot of texts. If you ever thought about how to make infographics cooler, this article will surely help you in creating information on graphics.
Infographics tools come Useful in:
Marketing – for creating visual appealing reports
Journalists – in presenting recent trends
Bloggers – to highlight the main points
Teachers – To create articles on the subjects
Students – Preparing study materials
Creating Infographics Helps you in:
Present annual reports and corporate communication
To attract inbound marketing traffic
To bring awareness/disseminate information
Present a case study
Teaching guide
How to make infographics: the Tools
Each Infographic must be a visual treat for the viewer plus who doesn’t like colored charts and illustrations?. Considering the case that everyone are not skilled in creating infographics from scratch using high-end graphic design softwares, a lot of developers put big efforts on creating cool infographic tools to help everyone with an IDEA to create cooler infographics easily. Enough Said, we consider creating infographics is easy with the following infographics tools.
Click on the images to use the infographics tool
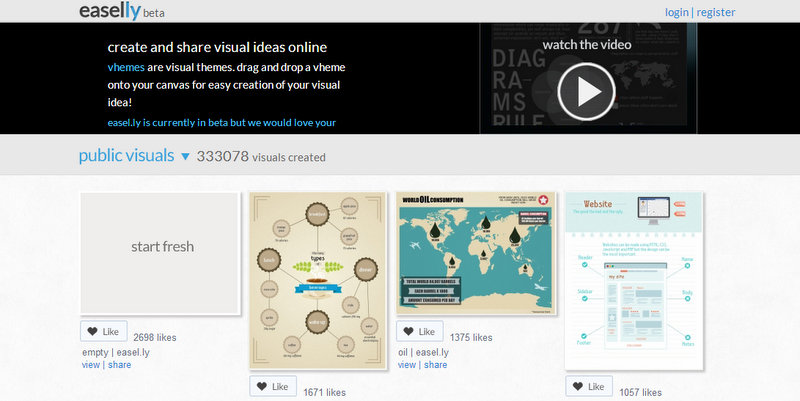
Easel.ly
One cool infographic tool to begin your infographic experimentations. You can customize the Easel.ly free templates according to your interest. For an awesome visual experience in Easel.ly, you should effectively make use of customizing the text with a range of fonts, colors, text styles and size. Also explore the library of things such as arrows, shapes and connector lines. You can also upload your graphics in Easel.ly and position them.So overall, Easel.ly will be a pretty good ‘pro’ fun tool for anyone who are new into infographic creation.
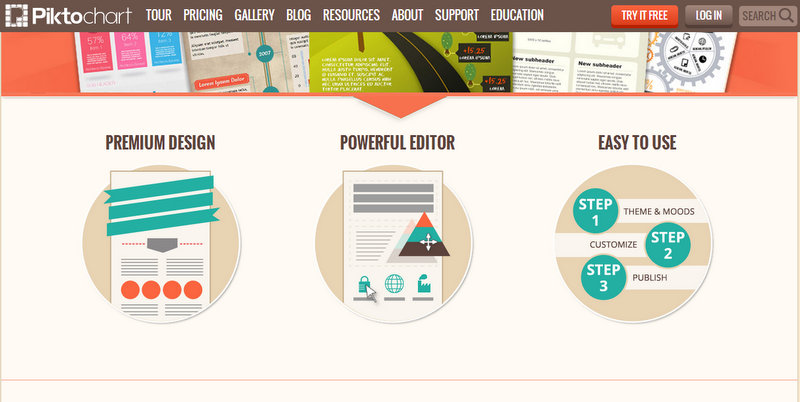
Piktochart
Another standard infographic and presentation tool which can help you to transform the texts to speaking images. Just like the previous tool we discussed, Piktochart also have the same features. It’s the grid lined templates, highlight of Piktochart. These grids lined templates make it easy to align graphical elements and resize images proportionally while creating infographic. Free version of Piktochart is similar to the Pro version, yet it has less images, customization and themes available. A pro account of the same costs $29 per month or $169 for a year.
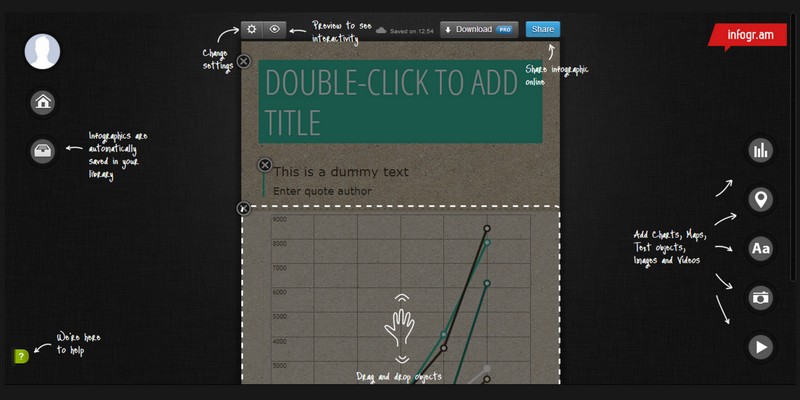
Infogr.am
Infogr.am is a great free tool for creating interactive infographics. It provides a wide variety of graphs, charts and maps also allowing users to upload images. Infogr.am has more than 30 chart types ranging from from bubble charts and treemaps to simple pie charts. The coolest feature of infogr.am is its built-in spreadsheet for easy data editing. Users can import their XLS, XLSX and CSV file. Infogr.am also providing several options besides saving infographics to computer as PNG or PDF, which includes adding infographics to presentations or email to colleagues, sharing and embed features. And if the data is sensitive, you can set a password or share infographic with a private link.
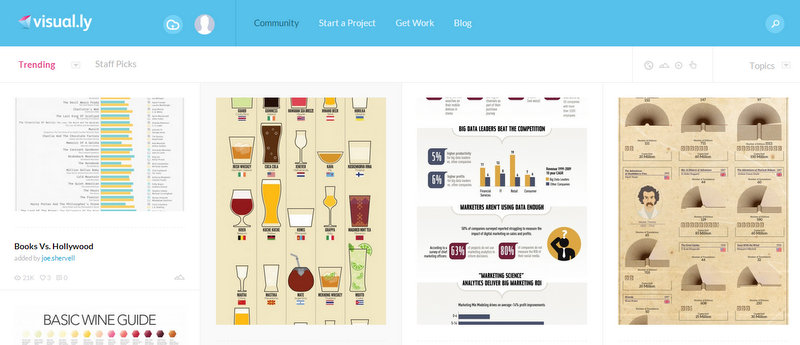
Visual.ly
With its community of more that 35,000 designers, illustrators, and journalists, Visual.ly is one super tool for creating data visualizations and infographics. Visual.ly also proves that you don’t have to be an analyst or designer to make creative infographics. Also Visual.ly helps you discover infographics and favorites from other users. It has a project timeline component which helps you to monitor the progress of your project and to ensure it stays on time and on budget.
icharts.net
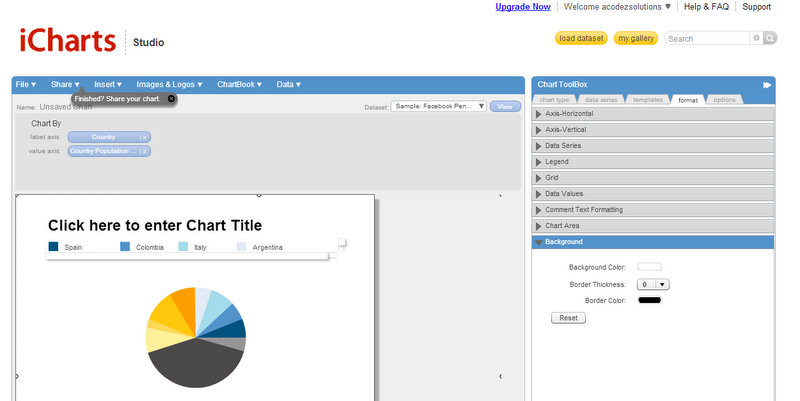
iCharts is great tool you can use for increasing Brand Awareness. More than a tool, iChart acts as a catalyst connecting publishers of market research, economic and industry data with professional consumers. iChart has a simple interface which helps people to discover and follow latest data insights. iCharts also hosts tens of thousands of charts in business, economy, sports, and other categories.
Creating infographics will be fun again with these effective tools and you never need to think hard on how to find good infographics tools. Hope checking these popular tools helped you in learning how to make infographics. View more of our related tools at blogs on design tips.
Looking for a good team
for your next project?
Contact us and we'll give you a preliminary free consultation
on the web & mobile strategy that'd suit your needs best.


